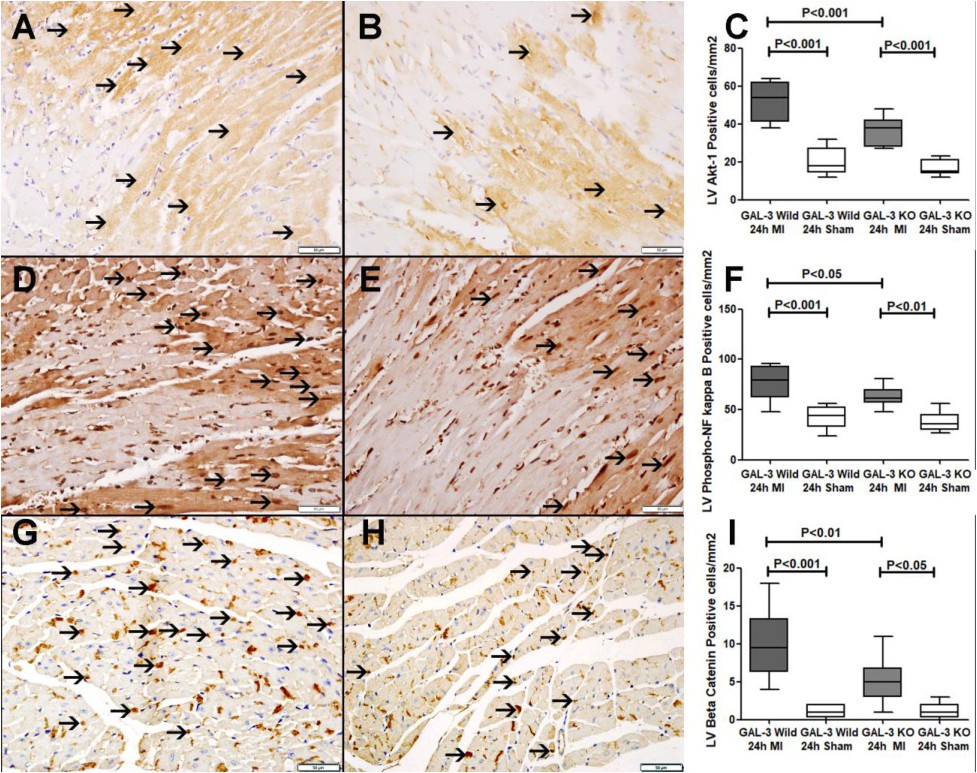
Fig. 7. A. Representative section from the LV of GAL-3 wild MI group at 24h following MI showing cytoplasmic expression of Akt-1 protein by cardiomyocytes in the ischemic area (thin arrow). B. Representative section from the LV of GAL-3 KO MI group at 24h following MI showing cytoplasmic expression of Akt-1 protein by cardiomyocytes in the ischemic area (thin arrow). C. A morphometric graph showing a significantly higher number of cells expressing Akt-1 protein in the LV of GAL-3 wild MI group than GAL-3 KO MI group. D. Representative section from the LV of GAL-3 wild MI group at 24h following MI showing nuclear expression of phospho-NF kappa-B protein by cardiomyocytes in the ischemic area (thin arrow). E. Representative section from the LV of GAL-3 KO MI group at 24h following MI showing nuclear expression of phospho-NF kappa-B protein by cardiomyocytes in the ischemic area (thin arrow). F. A morphometric graph showing a significantly higher number of cells with nuclear expression of phospho-NF kappa-B protein in the LV of GAL-3 wild MI group than GAL-3 KO MI group. G. Representative section from the LV of GAL-3 wild MI group at 24h following MI showing nuclear expression of beta-catenin protein by cardiomyocytes in the ischemic area (thin arrow). H. Representative section from the LV of GAL-3 KO MI group at 24h following MI showing nuclear expression of beta-catenin protein by cardiomyocytes in the ischemic area (thin arrow). I. A morphometric graph showing a significantly higher number of cells with nuclear expression of beta-catenin in the LV of GAL-3 wild MI group than GAL-3 KO MI group. Note: P value<0.05 is statistically significant.